

The Institute of Directors’ latest survey has an odd split. Directors’ confidence in their own organisations rose from -5 to +10 between August and September, while confidence in the UK economy slid from -49 to -54. Revenue expectations improved to +21, though they’re still below the long-run average. Investment intentions stayed negative at -8.
Caution is fair – costs are high and the outlook is uncertain – but waiting for the national picture to brighten could mean waiting a very long time. Feeling optimistic about Britain, understanding your own business and having enough evidence to decide what comes next for your SME are three separate things. The first isn’t in your hands but the other two are.
The Boardroom Punks’ Business Confidence Dashboard

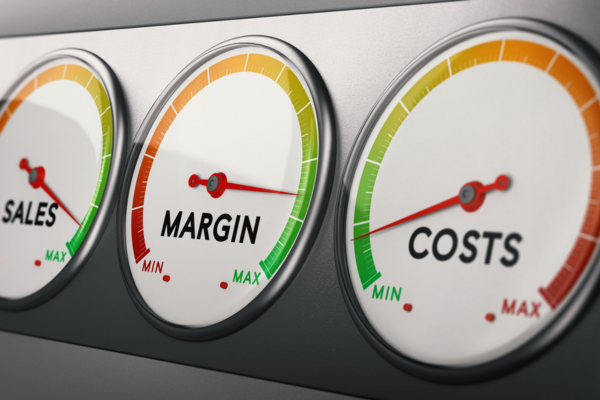
We’ve created a confidence dashboard to help you navigate these confident-but-still-pessimistic times with more clarity. We use seven numbers. None has a universal “safe” level, because sector, business model and stage of growth all change the answer. What matters is the direction yours are heading.
When you know that, you can make a more informed decision about what your next step is, whether you can afford it, what the impact could be day-to-day and whether you need additional support in the form of finance or consultancy to help you stride into that next phase.
Cash Runway
Divide your cash reserves by your recurring monthly costs including wages, rent, tax, loan servicing and key suppliers to see how long you could survive if the income stopped. Your cash runway is also a good indicator as to whether you can afford to take on another employee or invest in your business, for example by finally commissioning a web developer for that new website or agreeing a new lease for larger premises. If your cash reserves are not rising despite healthy sales, look at where the cash is going and why it’s flowing the wrong way.
The 12-Week Cash Position
Lay out your expected inflows and outflows per week for the next 3 months. The timing of the cash in and out is as important as the sums. Customers may be slow to pay whereas wages, tax, rent and suppliers need regular payment.
Even though the figures for the period as a whole may look healthy you could still experience weeks of cash shortfall. Without this element on your dashboard, those slower weeks could catch you by surprise.
Gross Margin
Subtract the costs directly associated with delivering your product or service from your turnover and calculate this as a percentage of sales. Rather than using turnover as an indicator, track how this margin changes over time. Gross margin will help you decide on your pricing and whether particular jobs are worth pursuing.
Break-Even Revenue
Calculate your fixed costs divided by your gross margin to understand the revenue you need to service your costs. It is well worth remembering this figure when considering financing decisions such as taking on staff, moving into new offices or reducing your prices as any of these could impact on the level of revenue needed to break even.
Debtor Days and Overdue Invoices

Debtor days is an indicator as to how quickly your customers are paying you. This could be considerably slower than the terms you operate internally for invoicing. Look at this indicator in conjunction with the value of outstanding invoices to get a sense of the level of cash tied up in receivables.
If customers take too long to pay, even an otherwise profitable business can quickly find itself running out of cash.
Pipeline Coverage
Compare the weighted value of your likely sales to your revenue targets. To calculate the weighted value of your sales opportunities, multiply the value of each deal by the probability of it closing.
A healthy pipeline of prospects can be misleading due to doubts over the likelihood of any one sale being secured.
Customer Concentration
Work out the percentage of revenue represented by your biggest customer and then do the same for your top three customers taken together. Imagine the impact on your finances if this large customer stopped trading or deferred payment for a further 90 days.
This can help inform your decisions on how much risk you are taking on as you grow your business based on the increased risk to cash flow of losing a single customer.
Turning the Numbers into Decisions

- Hiring: Before taking on new staff make sure you can afford to pay their salary in full while they get up to speed. Your cash runway and 13-week forecast will indicate if it is a good time to invest.
- Borrowing: When considering new financing, remember to think about what it will be used for. Securing funding for a specific opportunity may well be a good move if the maths make sense.
- Investing: Understand the return you require from an investment and how long it is likely to take to realise that investment. Your break-even figure and cash forecast will help you understand your capacity to invest and how long you should allow for the investment to pay back.
- Expanding: Before embarking on a new initiative look to see if there is likely to be demand, your resource can cope with the extra requirements, and you have enough cash to fund the new costs.
- Holding back: It is often the right decision to delay action, but it is good to have a number in mind for the costs of waiting. The costs of delaying a new hire, investment or expansion can be expensive if it means the opportunity has passed you by.
If cash is tight, you’ll find out early, while you still have options.
Not sure what your numbers are telling you? Talk to the Boardroom Punks. Our team of no-nonsense business experts who specialise in helping breathe new life into small businesses. We can help you gain clarity when everything feels confused and provide impartial guidance that helps you discover the right path for your business, yourself and your team.


